Have you ever run colcon graph --dot | dot -Tpng -o graph.png, waited a few minutes, and looked at unhelpful pngs?
Have you ever asked thought-provoking questions like:
- What package is depended on the most?
- Who maintains the most packages in this workspace?
- What is the predominant language used in this workspace?
Introducing: colcon_gephi
A colcon plugin to generate rich dependency graphs for a ROS 2 workspace that are compatible with graph visualization tools!
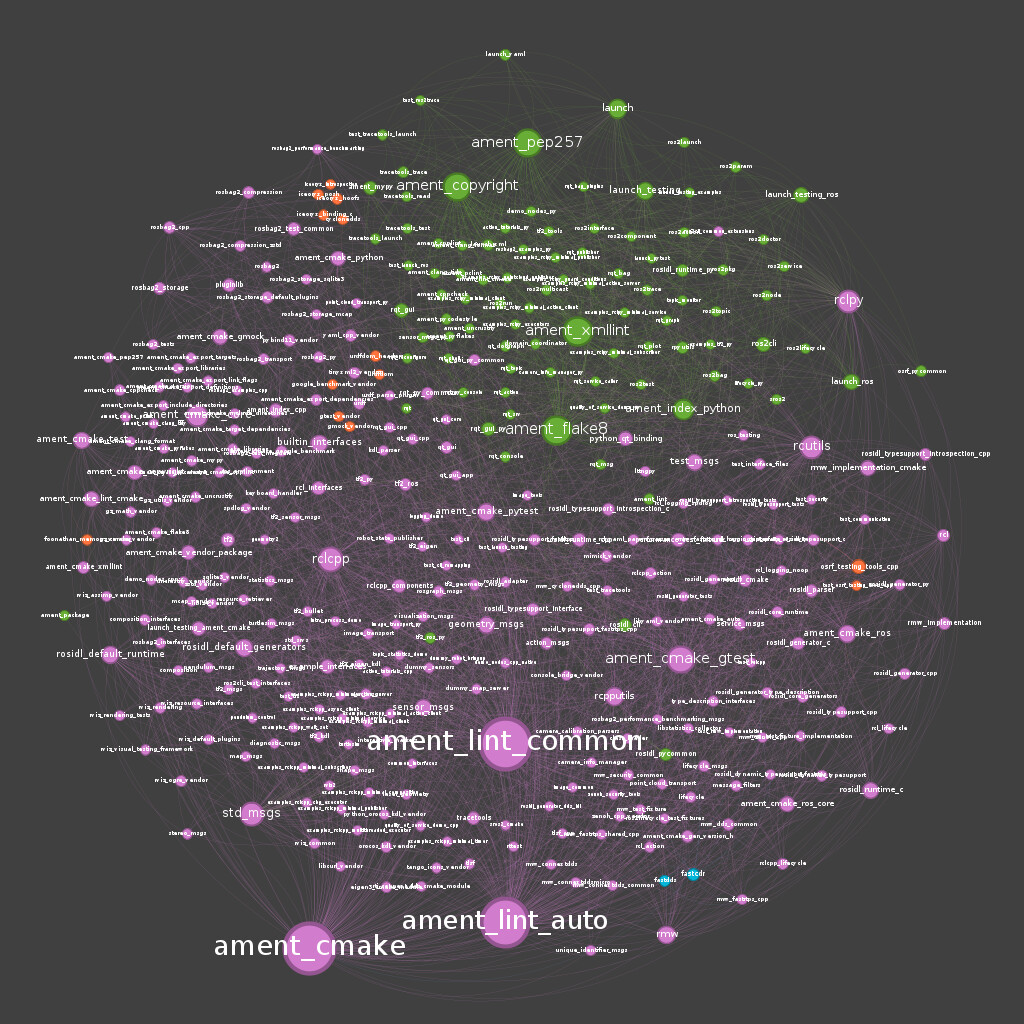
Below is an example graph of the workspace for the ros2 rolling repos. For details on what the graph actually is showing, see Example Graph Details.
Features
Currently supports exporting in:
- DOT (default, for Graphviz and other generic graph tools)
- GML (human-readable text format, supported by many graph libraries)
- GEXF (ideal for Gephi, preserves complex attributes)
Unlike colcon graph, this extension preserves extra package metadata (e.g., maintainers, repository info, build type) as node attributes. This makes it easier to analyze dependency relationships visually in Gephi.
- Generates a graph file from your ROS 2 workspace using the same package descriptors as
colcon graph. - Automatically includes the following as node attributes:
- Package path
- Build type
- Maintainers
- Version
- Git repository name and remote URL (if applicable)
- Lines of Code (LOC) stats (see Optional Dependencies)
- Includes edges for build, run, and test dependencies between packages in the workspace.
- Produces output ready to open in Gephi — no manual attribute editing required.
Usage
cd ros2_rolling/
colcon gephi_graph
The generated .dot file will have the name of the directory the command was run in. So in this case, it is ros2_rolling.dot.
To change the file format, pass the --format flag.
colcon gephi_graph --format gml
Notes
Graph Visualization Tools
As you can probably guess based on the plugin name, I primarily use Gephi as my graph visualization tool of choice. However, there are more out there which might work with some of the supported output formats. Cytoscape and Argo Lite are two examples although I do not test with these.
Example Graph Details
The graph generated at the top of this post was laid out by following this video. Larger nodes are nodes with more “in-degree” edges (i.e. edges pointing into them), which gives a visual representation of how many packages depend on them. Finally, the colors are based on the package build_type (i.e. ros.ament_cmake, ros.ament_python, etc).
